NFP Analysis and Talking Points
NFP分析和谈话要点
US Nonfarm Payrolls rose by 75k in May, missing expectations of 185k expected; Prior month revised Lower
5月份美国非农就业人数增加7.5万,低于预期的18.5万;上个月修订后降低
US Average Hourly Earnings falls short of consensus
美国平均每小时收入未达成共识
Markets Raise Bets of Federal Reserve Rate Cut
DATA RECAP
DATA RECAP
US NFP 75k vs. Exp. 185k (Prev. 263k, Rev. 224)
美国NFP 75k vs. Exp。 185k(Prev.263k,Rev。224)
Unemployment Rate 3.6% Exp. 3.6% (Prev. 3.6%)
失业率3.6%Exp。 3.6%(上一次3.6%)
Average Earnings M/M 0.2% Exp. 0.3% (Prev. 0.2%)
平均收益M / M 0.2%Exp。 0.3%(上一次0.2%)
Average Earnings Y/Y 3.1% Exp. 3.2% (Prev. 3.2%)
平均收益Y / Y 3.1%Exp。 3.2%(上一页3.2%)
NFP Report Review
NFP报告审核
US Bureau of Labor Statistics reported total nonfarm payroll (NFP) employment expanded by a 75k jobs in May, missing expectations of 185k. Alongside this, the headline figure for the prior month saw a downward revision to 224k from 263k, while the unemployment rate remained at the 3.6%.
美国劳工统计局报告非农就业人口总数(NFP) 5月份增加了75,000个工作岗位,低于预期的185,000个。除此之外,上月的标题数据从263k下调至224,000,而失业率维持在3.6%。
{14}
Wage Growth Eases
{14}
The Fed focussed wage data rose missed analyst estimates with the monthly reading showing a 0.1% rise vs Exp. 0.2%, which took the yearly rate to 3.1%. Overall, the disappointing report will further fuel expectations that the Federal Reserve will be cutting interest rates in the near-term.
美联储关注的工资数据上涨超过分析师预期,月度数据显示与Exp相比上涨0.1%。 0.2%,年率为3.1%。总体而言,令人失望的报告将进一步推动美联储将在短期内降息的预期。
Market Response
市场反应
The soft jobs reports saw a weaker US Dollar across the board, while US Treasury yields also edged lower. Consequently, gold prices have pushed higher with the precious metal hovering around 2019 highs as markets raise bets of a Fed rate cut.
USD Price Chart: 1-minute time frame (Intra-day)
美元价格走势图:1分钟时间范围内白天)
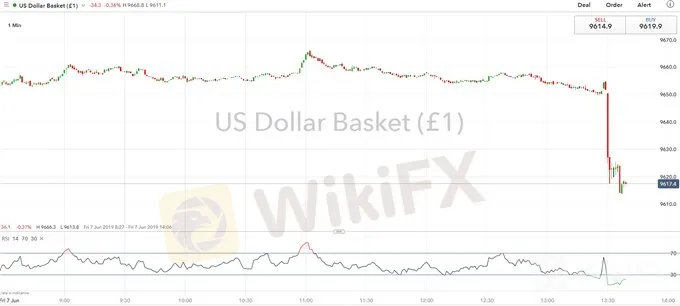
Chart by IG
IG图表
--- Written by Justin McQueen, Market Analyst
--- Justin McQueen撰稿,市场分析师