简体中文
繁體中文
English
Pусский
日本語
ภาษาไทย
Tiếng Việt
Bahasa Indonesia
Español
हिन्दी
Filippiiniläinen
Français
Deutsch
Português
Türkçe
한국어
العربية
FPG USDJPY Market Report November 3, 2025
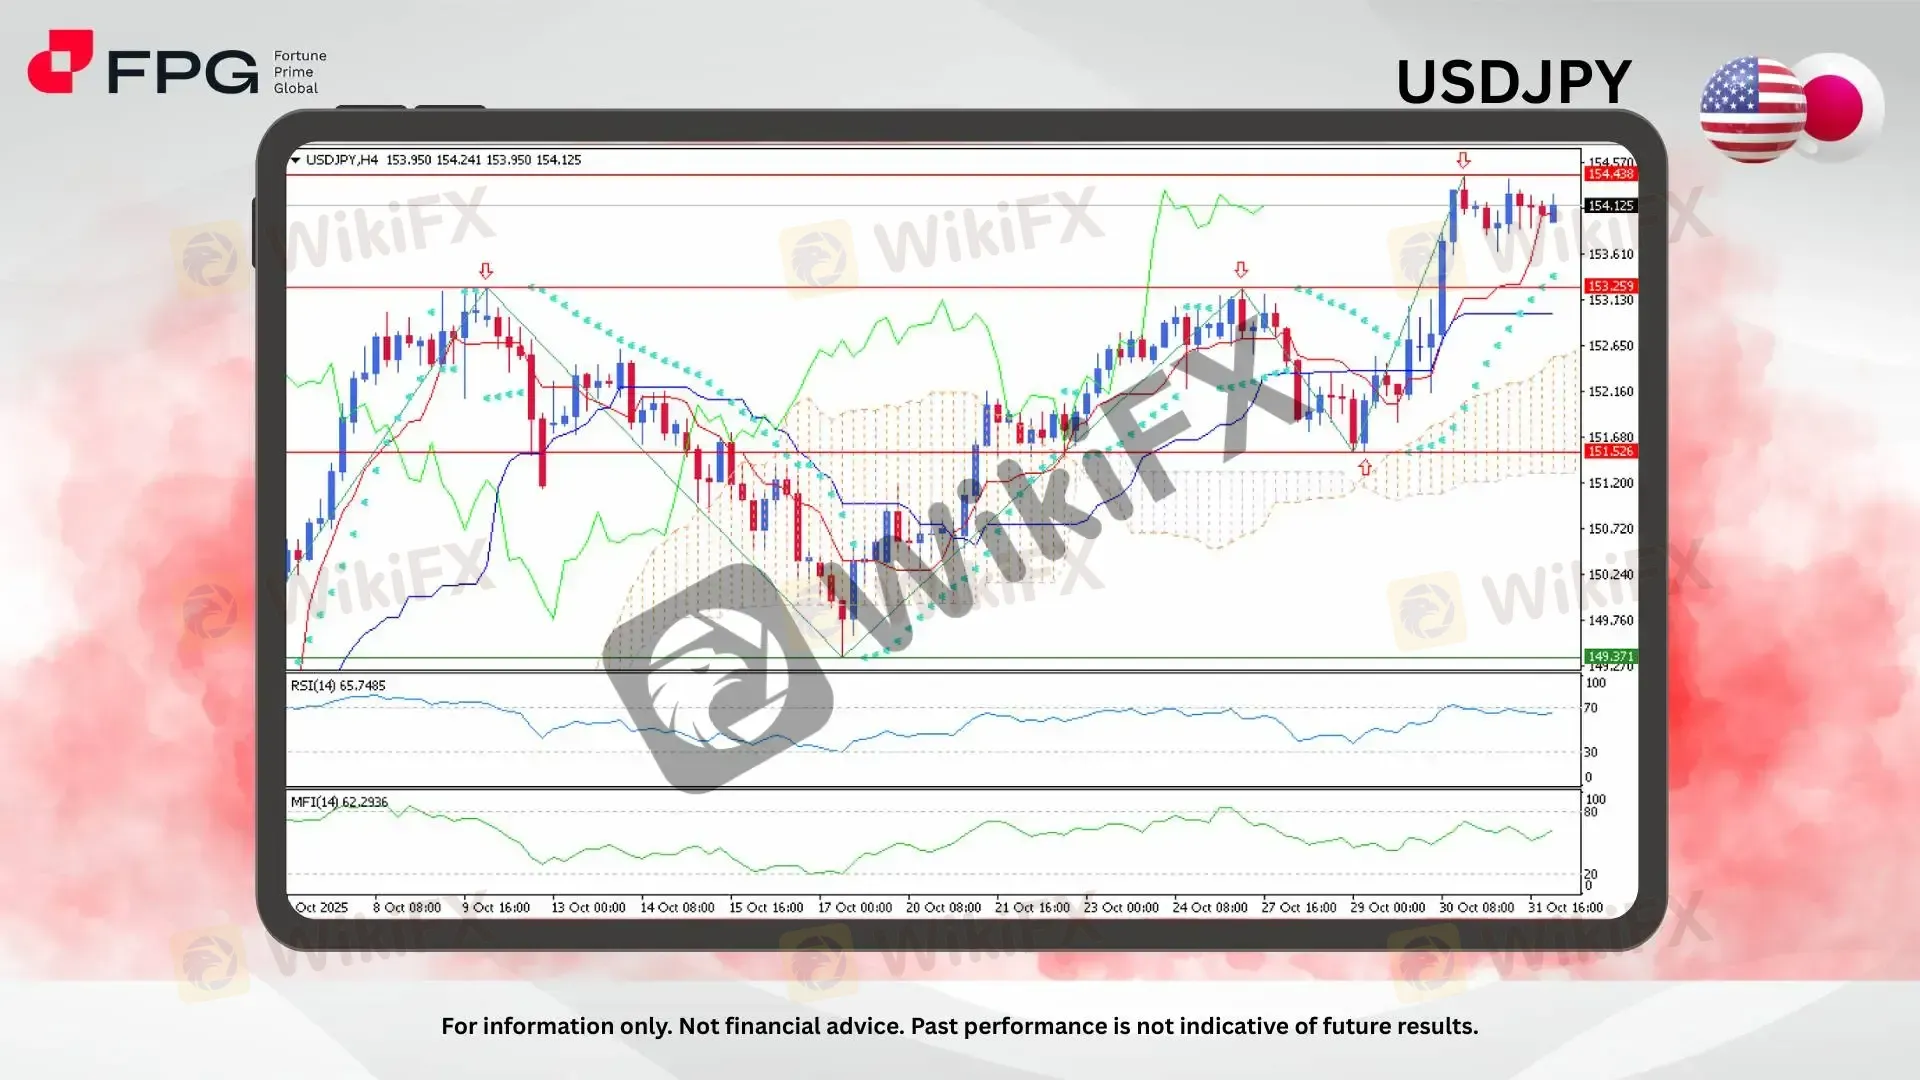
Abstract:USD/JPY extends its bullish trajectory on the H4 timeframe, trading around 154.12 after rebounding strongly from the 151.52 support zone last week. The pair has tested the upper boundary near 154.43,

USD/JPY extends its bullish trajectory on the H4 timeframe, trading around 154.12 after rebounding strongly from the 151.52 support zone last week. The pair has tested the upper boundary near 154.43, but recent candles show limited follow-through as the market consolidates near resistance. Despite the short-term pause, the broader outlook remains bullish, supported by sustained price action above the Ichimoku Cloud and the ongoing sequence of higher highs and higher lows.
Technically, USD/JPY maintains a strong uptrend structure after breaking above its previous resistance at 153.25, which now acts as a near-term support. The price continues to hold above the Tenkan-sen (red) and Kijun-sen (blue) lines, indicating an active bullish bias. The Parabolic SAR dots below the candles confirm the ongoing upward pressure, though the recent flattening near resistance signals possible short-term exhaustion. Price behavior around 154.43–154.57 suggests buyers may be taking profit, yet no clear bearish reversal has emerged so far, keeping the upward channel intact.
Momentum readings support the prevailing strength but warn of potential consolidation. The RSI (14) stands at 65.74, reflecting sustained bullish momentum without reaching overbought extremes, while the Money Flow Index (14) at 62.29 suggests moderate buying activity. Together, these indicators imply that while upside momentum is still present, traders should anticipate minor corrections before another potential push higher if support levels hold firm.
Market Observation & Strategy Advice
1. Current Position: USD/JPY is traded around 154.12, consolidating just below key resistance after a strong rebound from 151.52, maintaining its bullish bias above the Ichimoku Cloud.
2. Resistance Zone: The immediate resistance stands at 154.43–154.57. A decisive breakout above this range would open the path toward 155.20.
3. Support Zone: The nearest support lies at 153.25, followed by 151.52 as a stronger base; a break below 153.25 could signal a short-term correction.
4. Indicators: RSI and MFI remain in the bullish region, suggesting sustained buying interest, though momentum is beginning to cool. Parabolic SAR and Ichimoku both maintain bullish alignment as long as price stays above 153.25.
5. Trading Strategy Suggestions:
Buy on dips: Look for long opportunities near 153.25–153.50 if the bullish structure holds, targeting 154.43 and 154.57.
Sell near resistance: Consider short entries if price fails to break 154.57 or shows rejection patterns, targeting 153.25.
Wait for breakout: A confirmed move above 154.57 would signal bullish continuation toward 155.20, while a drop below 153.25 may indicate a shift toward consolidation.
Market Performance:
Forex Last Price % Change
EUR/USD 1.1527 −0.06%
GBP/USD 1.3135 −0.10%
Today's Key Economic Calendar:
AU: Building Permits MoM Prel
CN: RD Manufacturing PMI
CA: S&P Global Manufacturing PMI
US: ISM Manufacturing PMI
Risk Disclaimer: This report is for informational purposes only and does not constitute financial advice. Investments involve risks, and past performance does not guarantee future results. Consult your financial advisor for personalized investment strategies.
Disclaimer:
The views in this article only represent the author's personal views, and do not constitute investment advice on this platform. This platform does not guarantee the accuracy, completeness and timeliness of the information in the article, and will not be liable for any loss caused by the use of or reliance on the information in the article.
WikiFX Broker
Latest News
Spring Rally in Chinese Equities Signals Potential Lift for AUS and NZD
China’s Export Resilience: A Structural Pivot Towards the 'Global South'
Silver Smashes $70: Is the "Forced Central Bank Buying" Thesis Playing Out?
Biggest 2025 FX surprise: USD/JPY
NFA Charges Japan’s Forex Wizard and Mitsuaki Kataoka With Delaying Withdrawal Requests
Why Your Entries Are Always Late (And How to Fix It)
【WikiEXPO Global Expert Interviews】Robert Hahm: From Asset Management to AI Innovation
Treasury vs. Fed: Bessent leads Trump's Campaign to Reshape US Monetary Policy
Ceasefire on the Brink: 14 Nations Condemn Israel as Geopolitical Risk Premiums Rise
Ringgit hits five-year high against US dollar in holiday trade
Currency Calculator


