FCA-Regulated Forex Brokers Are Declining — 31 Platforms to Avoid
As of December 1, 2025, a total of 105 companies in the United Kingdom held CFD licences.
Original
简体中文
繁體中文
English
Pусский
日本語
ภาษาไทย
Tiếng Việt
Bahasa Indonesia
Español
हिन्दी
Filippiiniläinen
Français
Deutsch
Português
Türkçe
한국어
العربية

Abstract:Charts are the main tools for technical analysis. Charts are using to plot a sequence of prices and price movements of an asset on certain of duration. It is just a graphical way of showing how the stock prices have performed. Chart has an x-axis called horizontal axis and a y-axis called vertical axis. Generally y-axis represents the price and the x-axis represents the time. A chart always represents the history of the volume of trading in an asset.

Charts are the main tools for technical analysis. Charts are using to plot a sequence of prices and price movements of an asset on certain of duration. It is just a graphical way of showing how the stock prices have performed. Chart has an x-axis called horizontal axis and a y-axis called vertical axis. Generally y-axis represents the price and the x-axis represents the time. A chart always represents the history of the volume of trading in an asset.
Types of Charts
In chart, asset price comes such as stock, currency pair, commodity like so on in many varieties. It helps to understand in a quick way for individual traders or investors to choose one type over another. Charts are used for the following purpose:
• Comfort and Familiarity
• User-friendly and quickly identified
• Underlying purpose
There are different types of charts by using into the forex signals, we should go one by one and summarized with the following:
Tick Charts
Tick charts have a data point which drawn every time while the market moves or ticks. It means there is no certain time axis to a tick chart; it is just a short term trader just focus on the price action. In the tick chart you will see red line and blue line, red line shows the offer side similarly a blue line indicates the bid side of the market.
Suppose, when you want to take a look at a tick chart on MT 4, and MT 5, you could do double-click on the relevant currency pair in the Market Watch window to see details.
Point and Figure Charts
This is one of the best popular charts in forex trading that has allows:
• to filter exchange rate moves,
• identify clear support and
• Resistance levels as well as trade specific patterns.
This chart allows traders to focus purely on the exchange rate action. Moreover, point and figure charts are typically constructed on graph paper by using an X axis to fill a rising column of boxes and an O to fill a falling column of boxes. Every box represents a specified value that the exchange rate has to attain to justify marking an X or an O on the graph.
Line Charts
Line chart basically connect a set of single exchange rate observations and taken per time period with a straight line. These types of charts mostly used in closing prices and they also could be drawn through high as well as low prices or opening prices instead. A line chart has an x-axis with fixed time intervals.
Bar Charts
Bar chart is very easy to understand that shows the low, high, close and open for every time period by together forms a bar. The high and the low lines are connected with a vertical line with a small horizontal dash is shown at the open level protruding to the left. The closing level is shown by a horizontal dash to the left side. However bar charts have fixed intervals on the x- axis.
It is useful for identifying exchange rate gaps with the range of the first time period does not overlap that of the upcoming period.
Candlestick Charts
Candlestick charts invented by Japanese that offers more information than a bar chart because the color of the candles body signifies when the market increase or decrease in a particular time period.
Take an example, suppose a white body can be used to show a rising or bullish candle whereas a black body can be used to show a falling or bearish candle. The vertical lines are goes between the low and the open and between the close and the high are called “wicks”. Apart from that, some candles have long wicks and others have short wicks and this could be better half when we predicting subsequent behavior in the forex market. Candlesticks charts have predictive value and may be considered chart patterns in their own right so that many of them have colorful names like doji, hanging man, the hammer as well as shooting star.
What is the chart pattern to use when trading?
Chart patterns are important tool for traders that are utilized as part of traders technical analysis. Chart patterns play an integral part while you are looking for market trends and predicting movements for all like new comers as well as professionals. Traders are analyzed markets such as forex, shares, commodities and more.
Disclaimer:
The views in this article only represent the author's personal views, and do not constitute investment advice on this platform. This platform does not guarantee the accuracy, completeness and timeliness of the information in the article, and will not be liable for any loss caused by the use of or reliance on the information in the article.
As of December 1, 2025, a total of 105 companies in the United Kingdom held CFD licences.
Has Dbinvesting failed to honor your fund withdrawal requests? Did you notice that the broker remained fine when you were losing and turned worse as your numbers gained on the Dbinvesting login? Did the broker wipe out your profits and block your trading account? Many such allegations from users across India, the US and other regions have become headlines on broker review platforms such as WikiFX. To make it comprehensive, we have prepared an in-depth investigation report into user allegations, the company’s products and services, and, importantly, regulatory status, in this Dbinvesting review article.
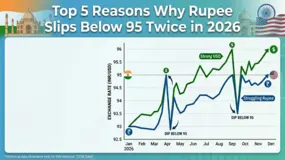
Times are tough for the rupee as it again slipped to 95 against the USD towards the end of April 2026 after some gains due to the RBI-led interventions early this month. The depreciation is largely attributable to surging crude oil prices. The prices climbed to their 3-year high over the US-Iran conflict. On April 30, 2026, the rupee opened at 95.02 mark against the USD, sliding 0.2% from its previous day’s ending at 94.84 against the greenback. As the day progressed, it slipped further to a new record low of 95.32 against the USD, beating the earlier fall of 95.22 in March 2026.
When you ask, "Is AssetsFX legit?", you're asking an important question about keeping your funds safe. After looking at all the available information, the answer is concerning: AssetsFX shows serious risks that traders should worry about. Our research found multiple problems that can't be overlooked. WikiFX, a website that checks brokers worldwide, gives AssetsFX only 2.44 points out of 10. They also warn users: "Low score, please stay away!" This very low rating isn't random. It comes from two main problems: the company doesn't have proper licenses from respected authorities, and many users have complained about losing funds. This article will explain the evidence behind this rating, giving you the facts you need to make a smart choice and protect your investments.
 WikiFXWikiFXWikiFXWikiFXWikiFXWikiFXWikiFXWikiFXWikiFXWikiFX
