FCA-Regulated Forex Brokers Are Declining — 31 Platforms to Avoid
As of December 1, 2025, a total of 105 companies in the United Kingdom held CFD licences.
Original
简体中文
繁體中文
English
Pусский
日本語
ภาษาไทย
Tiếng Việt
Bahasa Indonesia
Español
हिन्दी
Filippiiniläinen
Français
Deutsch
Português
Türkçe
한국어
العربية

Abstract:Probably one of the more compelling areas of price action is in its ability to show key levels or price zones that matter. And to be sure, there’s a lot of ways of finding potential support and resistance levels but none of those prices are worth very much if they don’t actually show as support or resistance.

For the purpose of identifying support and resistance, candlestick wicks can be incredibly powerful and this also speaks to multiple time frame analysis.
If youre following prices on an hourly chart and price suddenly reverses from a bullish trend, erasing the entirety of the move – how would that show on a daily chart?
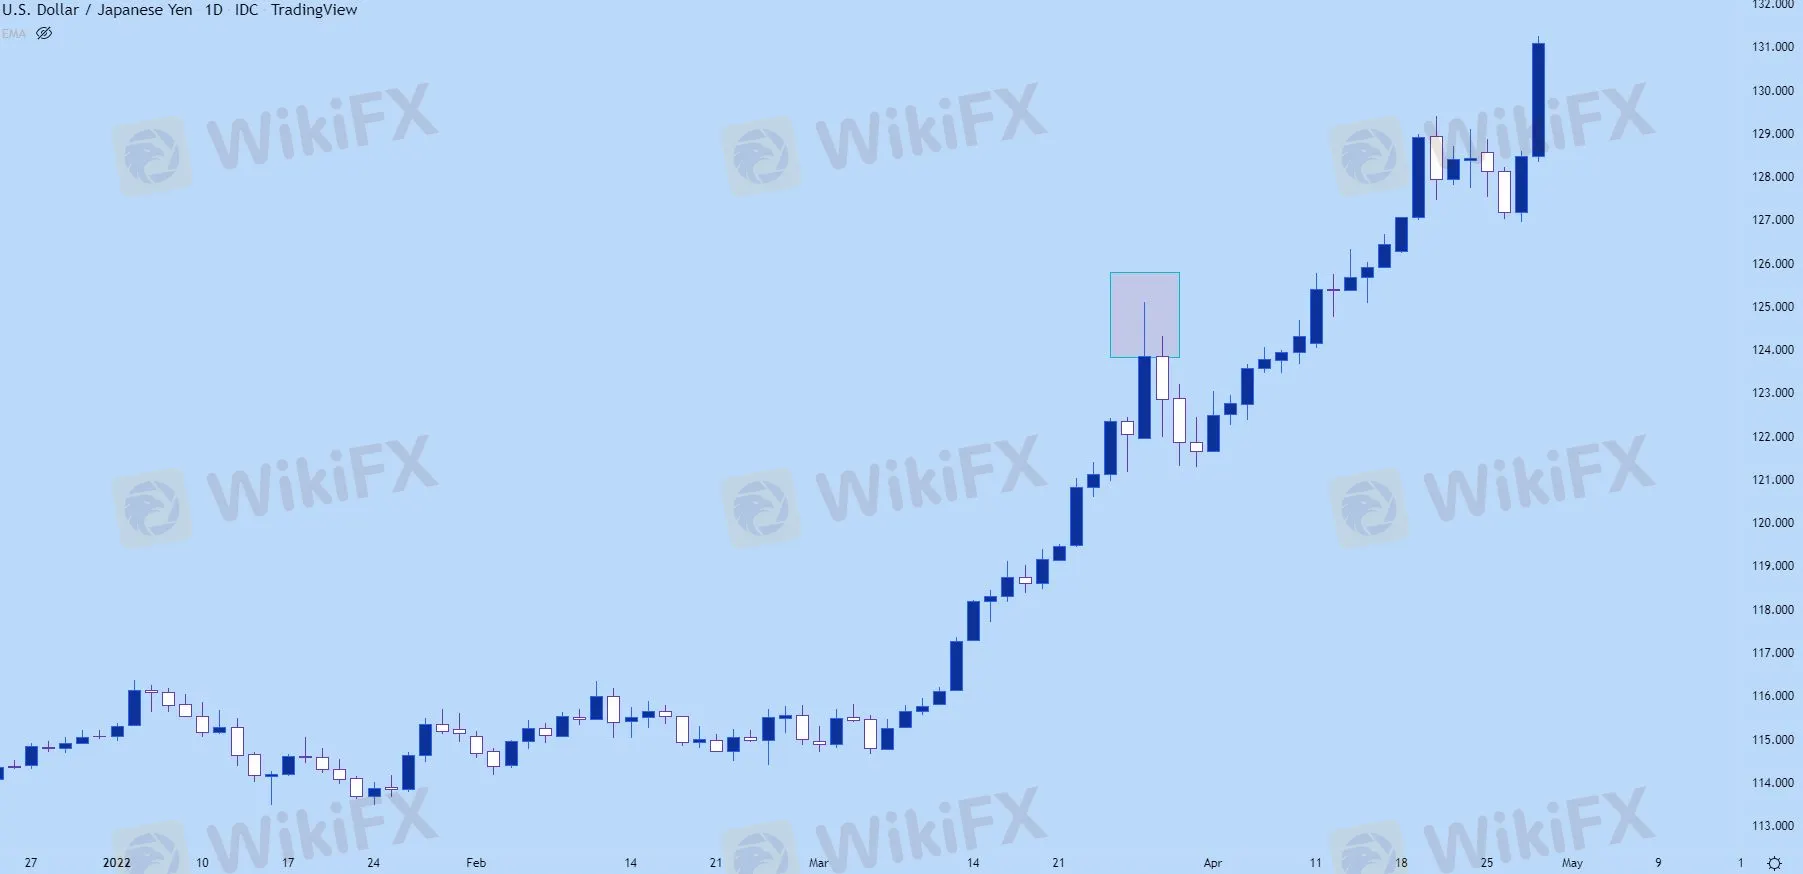
Likely, this will illustrate as a wick sitting atop that daily bar indicating the reversal that had taken place. On the below daily chart of USD/JPY, Ive identified such an extended wick, and notice that the three days that followed continued to see prices pull back despite a very strong trend that led into the move.
USD/JPY Daily Price Chart
On the below hourly chart, were taking a closer look at that same iteration and we can see that there was an extended upper wick there, as well, albeit much smaller than the wick that showed on the daily.
That three day sell-off started from a fairly clear reversal that had even showed on the hourly chart.
What‘s going on here: Likely there was a catalyst of some type that started a fast reversal and this is simply the playing out of that new ’bearish‘ factor getting priced-in. And, as we looked price action trends, trends do not move in a linear manner, its often a sequencing of ’two steps forward, one step back,‘ and that’s showing in the below example after the reversal began as ‘two steps down, one step up.’
USD/JPY Hourly Price Chart
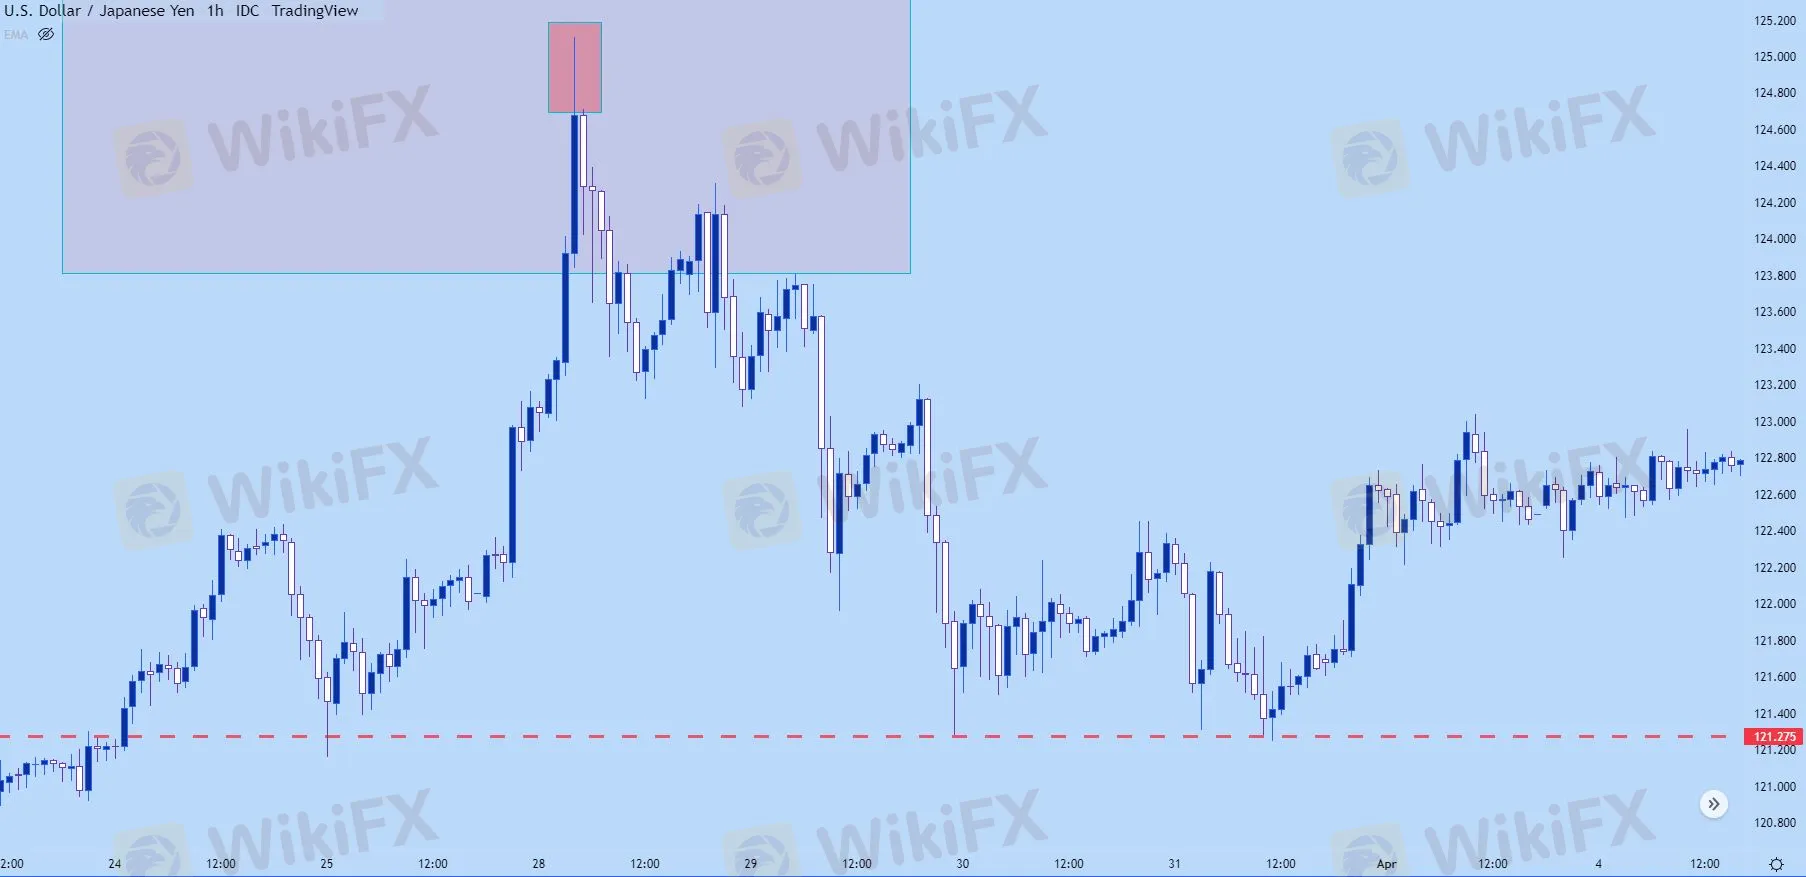
You might notice on the above chart, the red line along the bottom. Well that‘s pretty key for support and resistance identification when using price action, and we’ll dig into that in our next article on the topic.

Disclaimer:
The views in this article only represent the author's personal views, and do not constitute investment advice on this platform. This platform does not guarantee the accuracy, completeness and timeliness of the information in the article, and will not be liable for any loss caused by the use of or reliance on the information in the article.
As of December 1, 2025, a total of 105 companies in the United Kingdom held CFD licences.
Has Dbinvesting failed to honor your fund withdrawal requests? Did you notice that the broker remained fine when you were losing and turned worse as your numbers gained on the Dbinvesting login? Did the broker wipe out your profits and block your trading account? Many such allegations from users across India, the US and other regions have become headlines on broker review platforms such as WikiFX. To make it comprehensive, we have prepared an in-depth investigation report into user allegations, the company’s products and services, and, importantly, regulatory status, in this Dbinvesting review article.
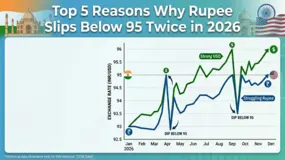
Times are tough for the rupee as it again slipped to 95 against the USD towards the end of April 2026 after some gains due to the RBI-led interventions early this month. The depreciation is largely attributable to surging crude oil prices. The prices climbed to their 3-year high over the US-Iran conflict. On April 30, 2026, the rupee opened at 95.02 mark against the USD, sliding 0.2% from its previous day’s ending at 94.84 against the greenback. As the day progressed, it slipped further to a new record low of 95.32 against the USD, beating the earlier fall of 95.22 in March 2026.
When you ask, "Is AssetsFX legit?", you're asking an important question about keeping your funds safe. After looking at all the available information, the answer is concerning: AssetsFX shows serious risks that traders should worry about. Our research found multiple problems that can't be overlooked. WikiFX, a website that checks brokers worldwide, gives AssetsFX only 2.44 points out of 10. They also warn users: "Low score, please stay away!" This very low rating isn't random. It comes from two main problems: the company doesn't have proper licenses from respected authorities, and many users have complained about losing funds. This article will explain the evidence behind this rating, giving you the facts you need to make a smart choice and protect your investments.
 WikiFXWikiFXWikiFXWikiFXWikiFXWikiFXWikiFXWikiFXWikiFXWikiFX
