Abstract:Much of trading is waiting. I get it, that’s not what you want to hear. You want action, you want riveting, you want excitement. Heck, this topic is called price ‘action’ so, there surely must be something actionable about it, right?

Well, the problem is, if you‘re not prepared for volatility when it shows up, there’s a very strong chance that you‘ll end up chasing your tail once it does. Most traders do, at least, and this is why many retail traders end up buying highs or selling lows – they get caught up in the excitement of a fast market and they don’t want to miss out (FOMO) but, on the same token they dont quite know what to do.
This is where digestion can be helpful, and I‘m not talking about eating a balanced breakfast. I’m referring to trading setups and the fact that markets, like most humans, operate in cycles. There will often be a burst of activity followed by a pattern of digestion as the market incorporates these new higher/lower prices. It‘s only rationale that traders that were long ahead of a strong spike will look to take profits. And the simple act of some traders taking profits can lead others to do the same, fearful of surrendering gains. And we’ll likely even get the contrarians in the mix, as they look to establish fresh shorts from new highs – all which can relate to a strong price move lower as supply exceeds demand at this new, higher price.
This is simply digestion, and it takes place on all time frames in multitude of ways. But, the devil is in the details, as they say, and digestion can often take the form of a price action pattern that traders can then use to generate trading setups.
THE TRIANGLE
The triangle pattern is one horizontal level and one trend line. Thats it. We have a full article on the ascending triangle, highlighting how a horizontal resistance level can be matched with higher-lows as produced by a bullish trendline to create the formation. The descending triangle, on the other hand, will have a horizontal level of support coupled with a bearish trendline showing lower-highs.
The key here is diminishing marginal impact. And let‘s tell the story from the perspective of a massive level of support, let’s look at an example in USD/JPY.
In early January 2022, USD/JPY set a swing high at 116.35. The pair had pulled back by a little under 300 pips but, a few months later, buyers were again rebuked at that same price. And, again, another pullback ensued – but this time – sellers couldnt drive as far as they could the first.
This is an illustration of that resistance at 116.35 carrying less impact on the second test as buyers had already pushed into that zone. This created an ascending triangle, with horizontal resistance coupled with higher-lows, which you can see on the right side of the below chart.
USD/JPY Daily Price Chart
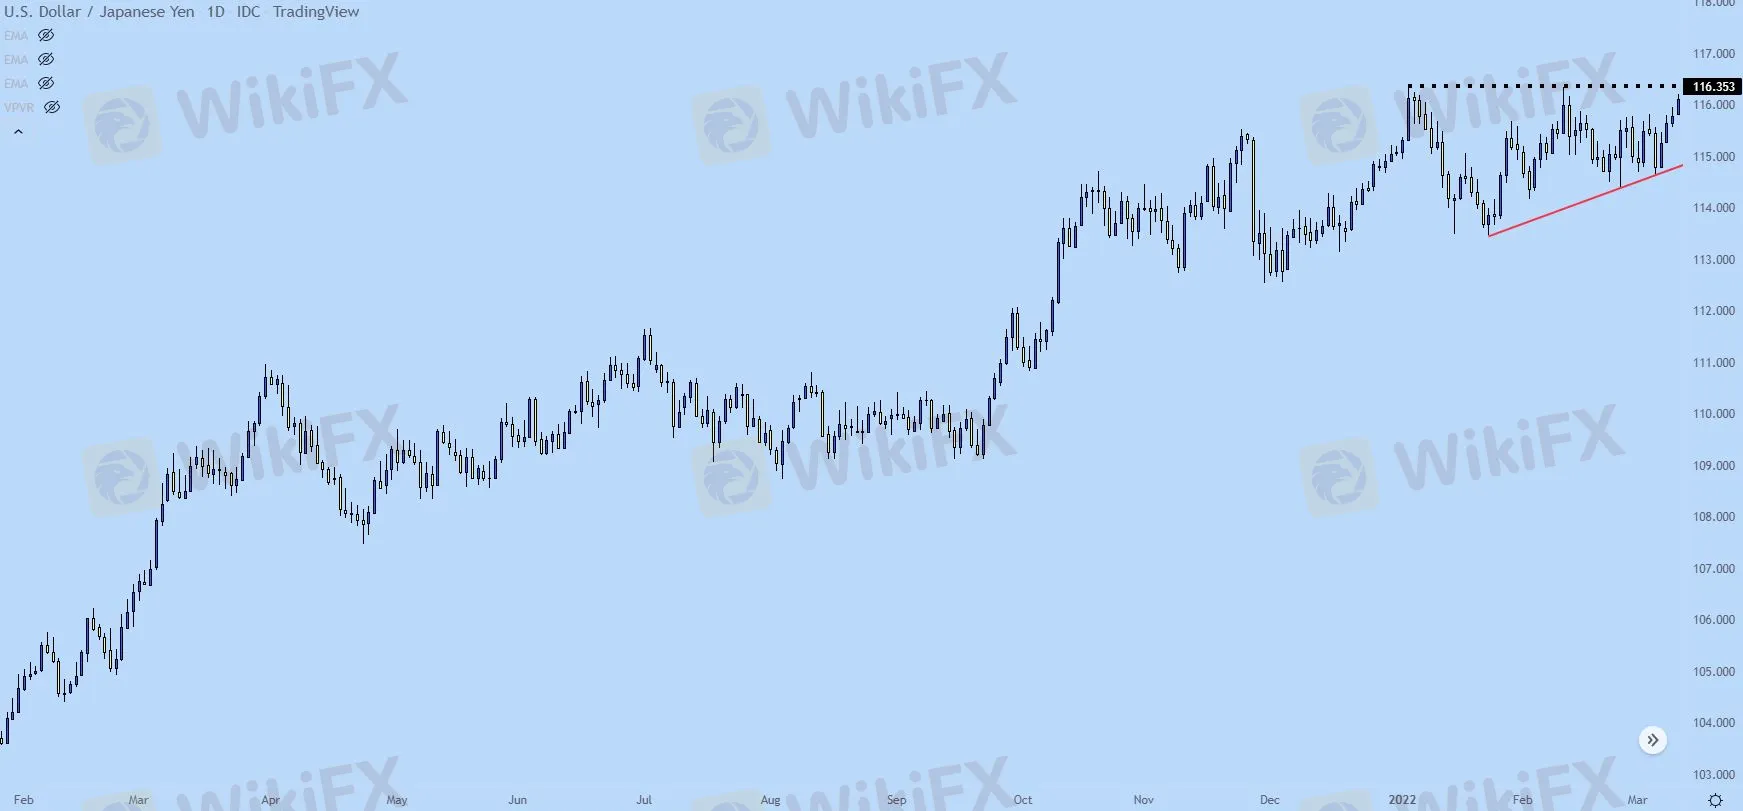
By the third test at that level – there were no more sitting sell orders, at least not to the degree that buyers could be dissuaded. And sellers didnt fare so well as buyers pushed an aggressive topside breakout of that formation.
USD/JPY Daily Price Chart

DIFFERENCE FROM THE WEDGE
The main difference between the triangle and the wedge is the horizontal support or resistance. In triangle formations, this is a level thats expected to be broken with enough persistence from buyers (for resistance) or sellers (for support).
The falling wedge, on the other hand, is showing that sellers are really aggressive near resistance or at highs while being passive around lows or support. This can often build in due to a major support or resistance level, as sellers look to avoid selling near that key support. But, that itself is deductive, as that passive nature near lows or at support can often lead-in to a reversal scenario, as we look at in our article on the topic of wedges.