
Globale Broker-Regulierungsanfrage-App
WikiFX
Deutsch
简体中文
繁體中文
English
Pусский
日本語
ภาษาไทย
Tiếng Việt
Bahasa Indonesia
Español
हिन्दी
Filippiiniläinen
Français
Deutsch
Português
Türkçe
한국어
العربية

Gold’s Super Bull Run – When Will the Party End?
Zusammenfassung:In yesterdays commentary, we reiterated our view that U.S. equities are bound to correct within this year. But what impact would a pullback in risk assets have on gold? In this piece, we extend our an
In yesterdays commentary, we reiterated our view that U.S. equities are bound to correct within this year. But what impact would a pullback in risk assets have on gold? In this piece, we extend our analysis through the lens of the business cycle.
I. Boom Phase
The period from 2023–2024 was the “golden age” of the growth cycle. As that phase comes to a close, we now enter the boom phase, which should keep equities in buy-mode through 2025–2027.
Drawing on the framework from IZAXX Business Cycles (a highly recommended reference for investors), the boom is divided into three stages. We are currently transitioning from the early boom (plateau phase) into the mid-boom stage.
Early boom: After a long expansion, corporate sentiment turns optimistic, leading to accelerated capital investment. This shift is what propels the economy into the boom phase.
Mid-boom: Monetary tightening through rate hikes and balance-sheet reduction begins to bite (the stage we are awaiting). Corporate CAPEX slows, but real economic activity remains robust, creating a plateau of high investment. Global risk factors (similar to 2018–2019 tariffs) are key influences here.
Late boom: As the cycle peaks, private investment surges one last time. Once monetary tightening ends and external risks fade, markets interpret this as an “all clear.” Strong consumer demand reduces fears of recession, prompting companies to chase missed opportunities with additional investment.
Why we believe we are deeply in the boom phase will be further explored in our next commentary.
II. Fed Balance Sheet Risks Coming Into View – Investors Must Not Be Complacent
Gold remains in a bull-market party, repeatedly hitting new highs. Mainstream narratives focus on three themes:
Anticipated Fed rate cuts.
Trumps tariff uncertainties, which weaken currencies and raise inflation risks.
Rising U.S. fiscal deficits.
Liquidity remains ample in both the U.S. and Europe, yet the U.S. faces looming liquidity risks. Many global central banks are already cutting rates, raising global liquidity and indirectly spilling into the U.S. This excess liquidity has propelled gold higher almost naturally. However, investors must look forward—macroeconomic data provides the leading signal.
In Q2, the U.S. Treasury issued only $650 billion in debt due to the debt ceiling, well below the $514 billion initially projected. In Q3, issuance is expected to surge to $1.01 trillion, which will significantly tighten liquidity and amplify market volatility—this time without a debt-ceiling constraint.
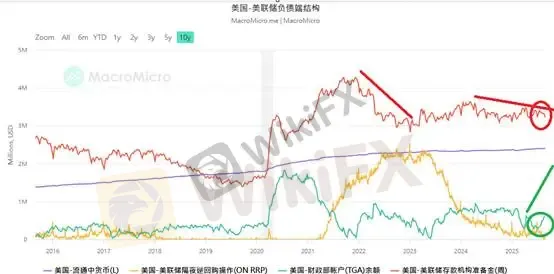
Figure 1 highlights how bank reserves are trending downward, while the Treasury General Account (TGA) balance is around $600 billion. To meet Q3 issuance needs, the TGA could rise back to 2021 levels. As bank reserves fall toward the warning line, downside risks for gold may finally surface.
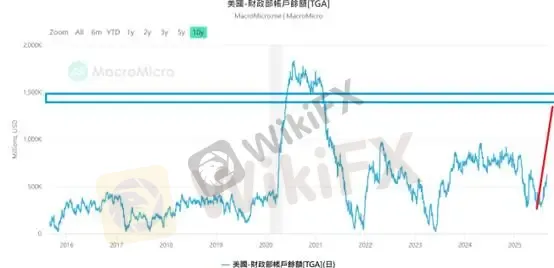
(Figure 2. U.S. Treasury General Account (TGA); Source: MacroMicro)
As equities roll over in the cycle and irrational mispricings emerge, we urge investors to listen to macro signals—waiting for the cuckoo‘s call. In this mid-boom stage, with gold surging into late summer, investors should keep an eye on liquidity—waiting for the raven’s call.
We believe the next liquidity storm will likely emerge in the U.S. and Japan.
Gold Technical Analysis
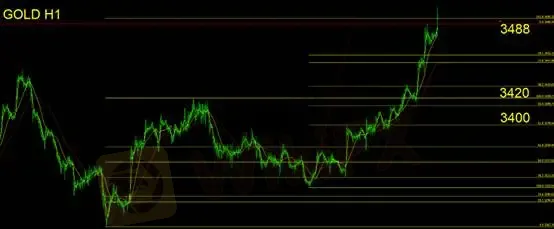
Gold has entered an overextended phase. Our outlook remains unchanged from yesterday:
Long positions may take profit or trail with stop-loss orders.
Short positions should avoid betting against the timing of a pullback.
From a technical perspective, gold is stretched in both short- and long-term waves, having already surpassed Fibonacci projections. We recommend staying flat and waiting for the next entry opportunity.
Support: 3488 / 3420 / 3400
Resistance: None significant at this stage
⚠️ Risk Disclaimer: The above views, analysis, research, prices, or other information are provided for general market commentary only. They do not represent the position of this platform. All readers should bear their own risks and trade with caution.
Haftungsausschluss:
Die Ansichten in diesem Artikel stellen nur die persönlichen Ansichten des Autors dar und stellen keine Anlageberatung der Plattform dar. Diese Plattform übernimmt keine Garantie für die Richtigkeit, Vollständigkeit und Aktualität der Artikelinformationen und haftet auch nicht für Verluste, die durch die Nutzung oder das Vertrauen der Artikelinformationen verursacht werden.
WikiFX-Broker
Wechselkursberechnung
USD

CNY
Aktueller Wechselkurs: 0
Bitte geben Sie den Betrag ein
USD
Konvertierbarer Betrag
CNY
Berechnen